Week 4: Probability and Statistics for Data
Chapter 5: Probability and Statistics for Data Science
Probability and statistics serve as the backbone of data science, enabling data scientists to comprehend data, make predictions, and assess model performance. In this chapter, we delve into two pivotal areas:
Descriptive Statistics: Descriptive statistics furnish a quantitative summary of datasets, facilitating comprehension and visualization. Key metrics include:
- Mean: Average value of a dataset.
- Median: Middle value in sorted data.
- Mode: Most frequent value in a dataset.
- Range: Difference between the highest and lowest values.
- Variance: Average squared difference from the mean.
- Standard Deviation: Square root of variance, indicating data dispersion.
For instance, considering a group's heights, mean height gives the average, range signifies the tallest-shortest difference, and standard deviation reflects height dispersion. Python offers straightforward implementations:
python
import numpy as np

heights = [167, 182, 175, 160, 190, 168, 159, 170]

mean = np.mean(heights)
median = np.median(heights)
mode = np.argmax(np.bincount(heights))
range_ = np.ptp(heights)
variance = np.var(heights)
std_dev = np.std(heights)

print("Mean:", mean)
print("Median:", median)
print("Mode:", mode)
print("Range:", range_)
print("Variance:", variance)
print("Standard Deviation:", std_dev) 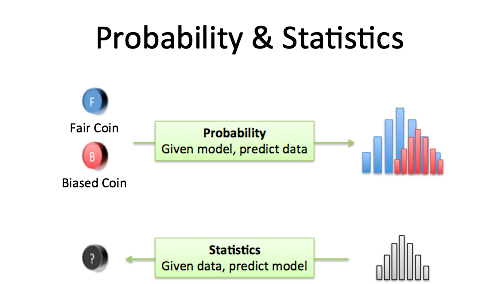
Furthermore, applying these statistics to real-world data like the Titanic dataset can deepen understanding.
Probability Distributions: Probability distributions elucidate possible outcomes for a random variable. Prominent distributions include normal (Gaussian), binomial, and Poisson distributions. The normal distribution, for instance, symmetrically distributes data around the mean, with most values near the mean.
Python aids in visualization and analysis. For instance, to plot a histogram of normally distributed heights:
python
import numpy as np
import matplotlib.pyplot as plt

mean = 170
std_dev = 10
samples = 1000

np.random.seed(42)
heights = np.random.normal(mean, std_dev, samples)

plt.hist(heights, bins=30, density=True)
plt.xlabel('Height (cm)')
plt.ylabel('Probability')
plt.title('Normal Distribution of Heights')
plt.show()
Similarly, utilizing the Iris dataset, we can analyze sepal lengths and generate informative visualizations.
In conclusion, mastering probability and statistics empowers data scientists to navigate datasets effectively, make informed decisions, and build robust models. These concepts are indispensable for anyone venturing into the realm of data science.


Comments
Post a Comment